Showing posts with label visualization. Show all posts

16 June 2013

Google Earth Project

The task is to create a Google Earth tour (KMZ file) of five locations to tell a story. 
Criteria
Your tour should meet the criteria below as well as include one or more advanced features: 
  • 5 cohesive placemarks are in a folder (Lesson 4.2) [5 points]
  • Each placemark includes a description of what is interesting about it (Lesson 4.2) [5 points]
  • Adjust the snapshot view of each placemark so that the placemarks make visual sense (Lesson 4.2) [5 points]
  • At least 2 placemarks include an image or a video (Lesson 4.2) [2 points]
  • Share the tour by uploading the kmz file to Google Drive (Lesson 4.4)
  • Include one or more advanced feature from the list below: [5 points]
    • The tour is narrated (with text or audio) (Lesson 4.3)
    • At least one placemark includes a look around (360-degree panorama) (Lesson 4.3)
    • A path is included (Lesson 5.1)
    • The tour has a nice flow: not choppy, fly through the terrain instead of jumping from place to place (Lesson 4.3)
    • A polygon is added (Lesson 5.1)
    • The kmz file is embedded in a website
    • The default touring settings have been changed
    • The tour goes underwater (Lesson 5.3)
    • Other media (music, images, audio clips) have been integrated
    • Overlays and 3D models have been included
    • The tour shows changes over time using historical imagery (Lesson 5.2)
    • The tour includes an imported KMZ/KML file
    • The tour uses Street View (Lesson 4.1)

and it doesn't work properly on the web page :-( advanced features are not supported

13 November 2011

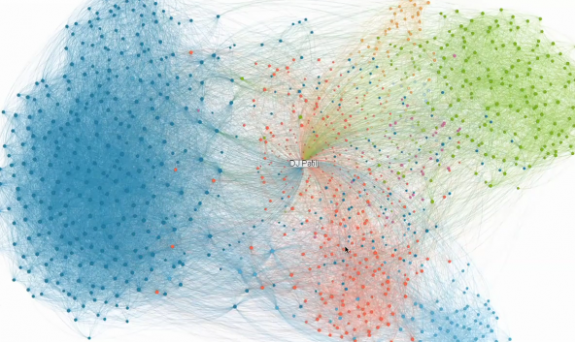
InMaps Your professional world. Visualized.

Just found out that LinkedIn has a tool to vizualize network connections.
My map. Deficiency: manual adjustments are not supported. I'd like to explode contacts.

The bigger amount of people connected + the more jobs you had, the more good looking map became. E.g.,

Give it a try.


12 November 2011

Visual Résumés

Not a long time ago Flowing data posted on its site about CV visualiztion. To get your visual CV you only need to sing up to http://re.vu/ or to http://vizualize.me/

Re.vu CV


Vizualize.me CV


Well, there are not so many templates, but settings are quite flexible. Enjoy!

02 June 2011

word cloud with styles

I am all about typographic map, inspired by Washington DC , World map, and UAE  I have even made several attempts to create some. It is the first step that is troublesome. Fortuitously, there is a Tagxedo . It turns words - famous speeches, news articles, slogans and themes, even your love letters - into a visually stunning word cloud, words individually sized appropriately to highlight the frequencies of occurrence within the body of text  with very user-friendly interface, many  different colors and themes, fonts  and really quick processing.  Idea of making map flashed into my mind. Firstly, I found the map with shape of Ukraine boundaries
and then decided to make a research - to compare result on  different search engines and visualize the 'view' Ukraine in the web. Here are my results:

#1 - Google


#2 - Bing
#3 - Wikipedia
 #4 - Yahoo
#5 - Answers.com

#6 - Ask.com

It doesn't work with  Ukrainian/Russian encoding, therefore there is neither popular ukrainian nor russian web searcher in the blogpost.
Enjoy Tagxedo!

P.S. Does anybody know what is 'The SitePK'?